Abstract
This article explains some basic principles of fractal geometry, from its discovery to its application in science and art. Also available in SPANISH.
What is a fractal?
A fractal is an object that displays self-similarity at various scales. In other words, if we zoom in on any portion of such an object, we will notice that the smaller section resembles the structure of the larger one.

Another very important characteristic of a fractal is that it has fractal dimension. That is, instead of being one, two or three-dimensional (as is the case with more familiar objects: 1D, 2D or 3D), most fractals have dimensions that do not fit into that conception. Actually, their dimension can rarely be expressed as an integer value. This is precisely what lies behind their name.
Some fractals conform to the previous definition while others do not, and in the latter new and different features show up in what would otherwise be a persisting pattern. That depends on the type of fractal we examine and the equation that produces the figure in the first place.
Probably the first pure fractal object in history, the Cantor set was described by the German mathematician Georg Cantor —inventor of set theory— in 1872. It is a very simple figure, yet it contains all the attributes discussed so far: it depicts self-similarity at all scales and has fractal dimension, with value around 0.630929753571457537099527114 (more appropriately, ). We can also use it to introduce another general characteristic of fractals: they are produced by iteration.
Iteration is a feedback process that repeats over and over, even infinitely. It refers to the act of calculating a function and taking the result, or output, as the starting value, or input, for the next calculation of the same function. Many such processes can produce fractals.
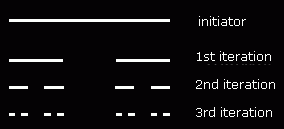
The Cantor set starts with a line (the initiator). We then divide this line into three equal segments, and remove the middle one from the figure. This operation (the generator) repeats for each remaining segment successively, producing the Cantor dust.
In the same iterative fashion, we can produce a Sierpiński triangle, a figure described by the Polish mathematician Wacław Sierpiński in 1915.
We start with an equilateral triangle, in which we draw a smaller one with vertices (or corners) placed at the midpoints of the sides of the larger figure. That process creates a smaller equilateral triangle that is inverted (upside down) with respect to the larger one. There will also be three additional equilateral triangles whose orientation will be the same as that of the original figure. Next, we proceed to remove the inverted triangle, leaving behind the remaining three. Then, we repeat the same process (iteration) for each small triangle, eventually obtaining a Sierpiński triangle, or gasket.


When we say, “remove the inverted triangle”, we do not simply mean to take the figure out, but that the points contained in its area (the triangle’s interior) do not belong to the set of points comprising the Sierpiński triangle. Hence, that part does not belong to the set.
Although fractals were known since the late 19th century (when they were regarded as mathematical curiosities), their common nature was finally recognized in the 1960s and ’70s through the studies of Benoît Mandelbrot and other mathematicians.
Further considerations on fractal dimension
In geometry, a point has no dimension, since it has no length, no width and no depth.
.
Figure 6: A point.
A line is one-dimensional because it has length.
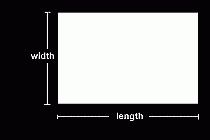
A plane is two-dimensional, since it has length and width.
And a box is three-dimensional because it has length, width and depth.
Thus far, we are referring to the ordinary concept of dimension (also called Euclidean or topological dimension). Fractals, on the other hand, have fractal dimensions, usually with non-integer values such as 1.7, 0.5326478 or 3.28. How can that be?
If we divide a one-dimensional object into two equal parts, we get two smaller versions of the same object.
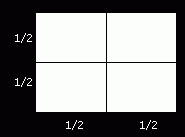
If we divide a two-dimensional object in half along both its length and width, we get four smaller copies of the same object.
If we divide a three-dimensional object in half along its length, width and depth, we get eight smaller copies of the same object.
A closer look reveals what can be termed, for illustrative purposes, as dimensional subdivision (following an exponential sequence), in which dividing an object along each of its dimensions will multiply the number of copies of that object exponentially: 2, 4, 8 and so on. Arithmetically, these numbers can also be expressed as:
Examining the exponent in each case, we find it equals the object’s dimension: 1, 2 and 3. Meanwhile, the number to the left of the equal sign represents the number of copies resulting from the division of an object that corresponds to said dimension.
Now, let us do the same with a fractal object such as the Sierpiński triangle. If we divide it in half along its height and base (the measures we use to calculate the area), we only get three copies of the figure (remember that the inverted triangle does not belong to the set). Then, we need an exponent such that 3 (the number of copies obtained from the division) equals ( representing the corresponding dimension we’re seeking).
The Sierpiński triangle is not one-dimensional because the number of copies, 3, is greater than 2 (the number of copies in the case of one-dimensional figures), but it is not two-dimensional because 3 is less than 4 (the number of copies for two-dimensional figures). So, its dimension must lie between those two values (1 and 2). In fact, it is approximately 1.58496250072115618145373894395.
Another kind of geometry
Fractal dimension is a concept that cannot be understood within the framework of elementary geometry. It arises in mathematical contexts where Euclid‘s postulates—those compiled by the Greek mathematician in the fourth century B.C.—are no longer sufficient (as the classical assumptions of geometric regularity and integer dimensions no longer apply), and where other geometric and mathematical realities emerge.
Why do we called them “fractals”?
The word “fractal” comes from the Latin word fractus, which means, “fragmented”, “fractured”, or more simply “broken”, very appropriate for objects with fractal dimensions. Benoît Mandelbrot coined the term in 1975. The study of fractal objects is generally referred to as fractal geometry.

What make fractal images so colorful and bizarre?
Fractal images derive their shapes and colors by assigning colors to each point (the input) based on its behavior (the output) as we repeatedly iterate the function with the aid of a computer. That’s also the only way we have to view them. We have several possibilities for assigning color values:
- If the output converges to 0 (hence, the point belongs to the set),
- If it escapes to infinity (hence, the point does not belong to the set),
- If it oscillates among a number of states,
- If it does not exhibit any discernible pattern.
Taking the Mandelbrot set as an example, the first case occurs inside the figure; the second, outside the figure; and the third and fourth cases, near the borders. If it weren’t for these color mappings, fractals would resemble any other plain and unattractive-looking graph.

More that meets the math
Fractals are mathematical objects, but a lot more as well. The first examples of such objects were mathematical constructs as the Cantor dust, the Koch curve (1904) and the Sierpiński triangle. Following those, which date back to the late 19th and early 20th centuries, came the works of Gaston Julia and Pierre Fatou on Julia set fractals (1918-19), and some decades later the studies of Benoît Mandelbrot and other prolific scientists-mathematicians on the Mandelbrot set, strange attractors and bifurcations, among others. Yet fractals are everywhere. There are many ordinary objects that, because of their structure or behavior, are fractals in nature. Clouds, mountains, coastlines, trees, and rivers are natural fractals. They differ from their mathematical counterparts in being finite entities instead of infinite ones. Other examples of phenomena with fractal behavior are the stock market and population growth.

Fractals have also crossed the border between science and art. Nowadays, many fractal artists produce gorgeous and skillfully-crafted representations of the mathematical counterparts. Fractal parameters can also be converted to sound notes to generate intriguing and fresh tunes. This has been termed as fractal music.
More recently, experts have realized that fractals may have been associated with art even before they were mathematically described. For many centuries, people have used repeating geometrical patterns as decorative elements in vases, architecture, book illumination and many other decorative arts that, in some ways, can be linked to fractal structures.


Figures 17, 18, 19: Hiberno-Saxon book illumination; detail of the Book of Kells, fol. 33r (left). Natural fractal structure: shell from a nautilus (center). Dome from the Sagrada Família, Barcelona, Spain (right).
Other studies have also demonstrated that many musical styles follow the 1/f noise characteristics associated with fractal patterns in nature, such as those found in pink noise and river flow variations.
The most complex mathematical object
Although Benoît Mandelbrot discovered this object, Adrien Douady and John H. Hubbard named it after him in 1982. The very peculiar figure has been reproduced on innumerable occasions since the first computer-generated image was rendered around 1980.

The mathematical function that defines the Mandelbrot set can be expressed as the set of all (a complex number) such that iterating (starting with ) does not go to infinity. The equation in itself is very simple; the resulting graph, infinitely complex. A computer is essential for working with fractals like this due to its fast computational capabilities. If we were to try it by hand, we would never finish in a lifetime.
Gaston et Benoît: Benoît et Gaston
Mandelbrot and Julia sets are closely related. The Mandelbrot set iterates with starting at 0 and varying . The Julia set, on the other hand, iterates the same function, but for fixed and varying values. Each complex number specifies the geometric structure of the corresponding Julia set. If is in the Mandelbrot set, then the Julia set will be connected. If not, the Julia set will be a collection of disconnected points plotted on a graph.

Figure 20: Mandelbrot-to-Julia transformation.
Complex numbers
The existence of Mandelbrot and Julia set fractals depends on complex numbers. But if we are going to talk about the latter, we have to introduce imaginary numbers first. Two Italian mathematicians, Gerolamo Cardano and Rafaele Bombelli, developed both types of numbers in the sixteenth century.
We know that negative numbers have no square roots expressible in real numbers. Nevertheless, mathematicians introduced the imaginary unit defined as the square root of (hence their name).
or
Hence, complex numbers are those composed of a real part and an imaginary one. The real part is a real number —for example, -2, 1, 1/2, or 0.2154—, while the imaginary part is a real number multiplied by the special number , as in . An example of a complex number would be .
Not all fractals are made by the iteration of mathematical expressions with complex numbers. Iterating simple geometric figures also produce some of them. The Sierpiński Carpet, for instance, derives from a square.


Figure 21: From left: second, third and forth iterations of the Sierpinski carpet.
Equations, functions or formulae?
An equation is defined as a statement which shows that two mathematical expressions are equal, such as .
A function is an association between two or more variables, in which to every value of the independent variable, or argument, corresponds exactly one value of the dependent variable. Simply put, in a function such as , (which can also be written as ), the value of depends on and varies with that of . In that expression y is the dependent variable, while x is the independent variable. The set of all possible input values is the function’s domain.
A formula, on the other hand, expresses a mathematical fact or relationship. As an example, the formula for calculating the area of a triangle is , where is the area of the triangle, is the base, and is the height.
When we talk about the Mandelbrot set, , it is more appropriate to call it a function. Although it is an equation (showing equality), it is fundamentally a mapping where each input z yields exactly one output.
Fractals and chaos
For several reasons fractals have been associated with chaos theory. However, there are many fractal objects that have nothing to do with the latter. As we have seen, many of the early simple fractal constructions date from the late 19th century, long before chaos theory emerged in the 1960s. Yet, due to the technological advances in computer science during the 20th century, chaos theory has generated some new types of fractals. One of the pioneers of chaos theory was Edward N. Lorenz, though Jules Henri Poincaré talked about what Lorenz named the “butterfly effect” as early as the 1890s.

Strictly speaking, chaos theory is the study of nonlinear systems, in which output changes are not proportional to input changes. Extreme sensitivity to initial conditions characterize these systems. In them, each state is determined by its previous state, and small changes in initial values lead to dramatically different outcomes. The weather and population dynamics are examples that exhibit both chaotic behavior and fractal characteristics.
Applications of fractal theory
Thanks to the discoveries of chaos theory and fractal geometry, scientists have been able to understand how systems once thought to be completely chaotic actually exhibit structured patterns. One of the most significant contributions of fractal geometry is its ability to model natural phenomena, such as plants, geological formations and atmospheric phenomena. Fractal theory has also contributed to such diverse fields as linguistics, psychology, image compression technology, superconductivity, circuitry and other electronic applications.
Juan Luis Martínez
This article was created on 1999.06.21 (Monday)
Revised on 2026.01.06 (Tuesday)
Updates
- Monday, 2025.02.17 – Added Wikipedia links to some terms and names, and did some minor revisions.
- Sunday, 2025.04.20 – Substituted old pictures and added credits to third party content.
- Tuesday, 2026.01.069 – Revised some sections for clarity and precision. Eliminated the Addendum about geometries (it never added anything to the scope of this post).
Note: This article was written mainly based on the information about fractals and other mathematical concepts in Jan Gullberg, Mathematics from the Birth of Numbers (WW Norton & Company, 1997). Since I intended this to be just an “illustrative” (non-scientific) work, I didn’t include a proper reference section. Consult other more rigorous sources for precise information.
Credits:
Book of Kells. (800 A.D.). Fol. 33r [Photo]. Digital Collections, The Library of Trinity College Dublin. https://doi.org/10.48495/hm50tr726
Sabadell, Catalunya. (2011). Sagrada Família, nave roof. [Photo]. Wikimedia Commons. https://commons.wikimedia.org/wiki/File:Sagrada_Familia_nave_roof_detail.jpg
Valle Duarte, S. (2016, August 23). A Nautilus macromphalus shell inside. [Photo]. Wikimedia Commons. https://commons.wikimedia.org/wiki/File:A_Nautilus_macromphalus_shell_inside.jpg


